Formative Assessments Made Easy
Because formative assessment tells us so much about how our students are doing throughout the learning process, it is more timely, and thus effective, to respond to it. Below are some field-tested template methods for gathering formative assessment data in inclusive classrooms. Their efficacy in moving forward student progress has a strong record (Cornelius, 2013). Classroom methods for measuring student growth also has a proven base of efficacy (Deno, 2003), all inspired by extensive curriculum-based research and measurement. Three such methods are outlined below:
Daily Scorecard
- Use daily IEP and SLOs goals and objectives to move along lesson targets by allocating a section of daily instruction to it.
- Use open-ended questioning to encourage student progress toward curriculum objectives
- Design future learning experiences based on this data.
- Use reflective questions to create a one-page visual summary of students’ formative data to reflect on the curriculum objectives to determine movement toward the objectives
Scorecard Components: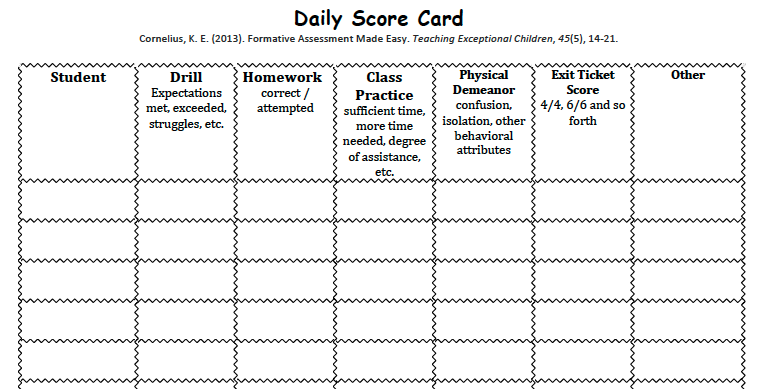
- drill
- homework
- class practice
- physical demeanor
- exit ticket
- other
Download the Daily Scorecard Spreadsheet
Scorecards can be personalized to meet specific students’ needs, with probing questions asked to fill in background knowledge about students and review benchmarked progress milestones. Scorecards are nice opportunities to fill out anecdotal data on students, such as work completion with specific areas of struggle. Astudent might have seemingly understood the reading for example, or read aloud with fluency, but was unable to complete the short answer response in follow-up, or use evidence to support ideas.
Scorecards can also be driven by questions designed to facilitate reflection, and feed planning. “Class Practice” would be the homework column, or group work. The teacher would use guided practice opportunities to note whether students are engaged, reflecting the following questions as a starting point from which to make further inquiry:
Drill Column:
- Are the students meeting my expectations?
- Are the students provided with extended time or assessment modifications per their IEP?
- Are the students still struggling with a concept, or struggling with a new concept?
- Was the student on task for the duration of instruction? If not, what portion?
- Who was ready, and who needed more time? (delineate who was ready, and who needed more time)
- Do the students look confused? (note who)
- Do the students look uncomfortable, and if so who?
Exit Ticket:
- Mark student responses, who finished first, etc.
Other:
- Note areas that need follow-up
Anecdotal Seating Chart
An anecdotal seating chart is another opportunity to gather anecdotal data about individual student progress along a continuum of learning goals. A complete picture of student progress can be had when we can overview information in one place (Alberto & Troutman, 2012). Anecdotal seating charts are basically oversized seating charts constructed using shapes and other features, arranged in boxes that resemble desk or seat placement. Make the boxes large enough to fit the student data in, it provides a nice housing place next day review, instructional planning, or even group placement. Reviewing the anecdotal seating chart can also inform grouping and differentiation methods. Using IEP goals or SLOs can help yield specific progress in movement toward larger goals such as reading comprehension, writing process, or mathematical proficiencies. Open-ended questioning will encourage student reflection on their progress, and help inform future design of new learning objectives.
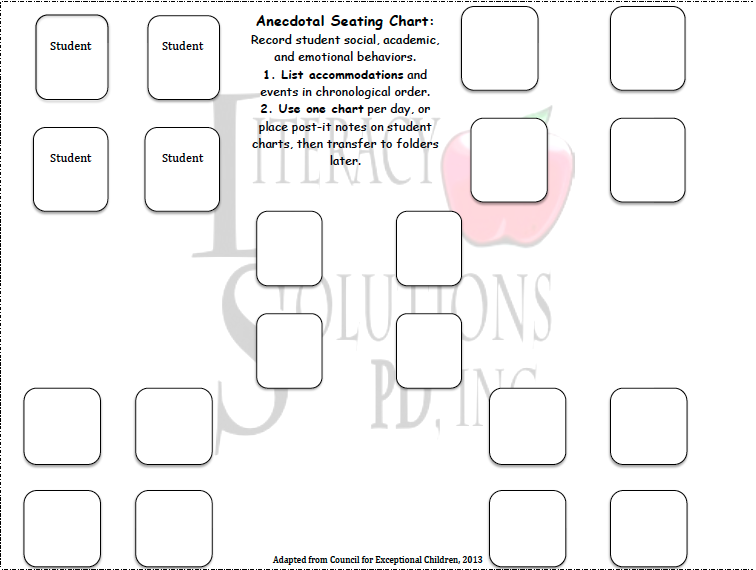
**Be sure to adjust student seating charts as they transition to other classes and activities.
Download the Anecdotal Seating Chart
Objectives Grid
An objectives grid helps capture student data regarding specific and discrete behaviors. Behavioral frequency, triggers, and other traits are recorded to help triangulate an overview of observations into a conclusion that works into planning, grouping, and overall behavior management. Observing beginning and ending behaviors feeds into this, and follow-up recording can include academic behaviors as well as social and emotional behaviors. Objective grids can also monitor movement toward IEP goals and SLOs, using a separate worksheet for each student in Excel, or separate sheet for each student on a clipboard for later placement in their folder. An Objectives Grid can be considered a baseline planning template, to be arranged around a daily schedule, curriculum content, a workbook, or even IEP caseload management depending on the structure and organization of the school. They make a nice spreadsheet for sharing academic, social, and emotional behaviors with an IEP team. Using an Excel can help compute a score for each student by assigning a value to each objective being monitored. Or number of occurrences can be divided by the number of opportunities to compute a percentage. Use this data to compare students’ progress from other lessons, units of instruction, or behavioral circumstances such as work in cooperative learning groups.
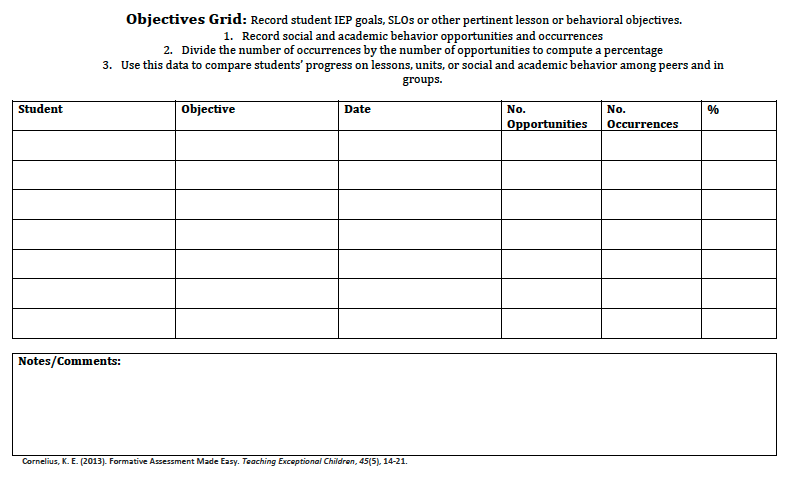
**Share this data, and data collection techniques, with other members of the student's IEP team.
Establishing a Culture of Data
Bambrick identifies four areas for data-driven implementation, among them and with the most extensive indicators, is a data-driven culture (Bambrick, 2010). Included are:
- Active leadership that facilitates data analysis meetings among staff
- On-going professional development with models of data-driven strategy and instructional effectiveness
- Rigorous use of interim assessments
- Planning for, and borrowing from, best practices with proven efficacy in data-driven environments (p. 242).
Learning Communities
Creation of a learning community is vital to maintaining a mindfulness that facilitates the steady flow of communication and collaboration needed. Effective data teams and learning communities include:
- Willingness to share without judgment
- Collegial cooperation
- Questioning process for its own practice with reliance for answers steadfastly on its own members.
- Employs a problem-identification process
- Responsibility for change or action planning is given to those most affected
How do we know we are living and thriving in a data-driven school, in a data-rich environment? When everyone acknowledges they are in one, and are in fact surrounded by an array of rich data sources (Bambrick-Santoyo, 2010; Halverson, 2005; Hoovers, 2011). Teachers determine the efficacy and effectiveness of activities, tasks, and programs; they in essence become their own solution in a collegiate, collaborative atmosphere of problem-solving, action research, and trial-and-error learning. Problems are identified and solved by those charged with implementing necessary change - the teachers.
Other data culture attributes:
Assessment data should be used formatively to identify student strengths and areas of need, with determinations made within interdisciplinary teams. Action steps are positive and proactive, with assessments viewed as the data, and the ensuing action as the response. Assessments are scheduled regularly, along with interim assessments, with action research deliberate and solution-oriented (p. 40).
Other evidence of a data-driven environment:
- There is school-wide visibility and openness, with questions asked and answered directly.
- Study and inquiry groups meet and share regularly.
- Professional learning communities are in place, either vertically or horizontally or both.
- Everyone takes equal responsibility for their own progress.
Action is generated from within faculty, rather than imposed upon from the outside, and thereby teachers are intrinsically motivated to plan and conduct action research as a result of data analysis. Teachers become, and remain, their own resource, analyznig data with the actual data in hand. This means, no grading or looking at responses without the question in hand that drove them (Bambrick-Santoyo, 2010). “Results provide almost no meaningful information unless they can be seen in the context of the assessment itself (Bambrick-Santoyo, p. 45). Use of a template to identify and answer questions next to the standards they addressed is recommended. Use of data reporting templates allows teachers to identify gaps in learning and develop immediate action steps on them.
A data culture allows the teachers and the data do the talking (p. 60). Here are some other recommendations for data analysis:
- Always point to the data at-hand, returning to specific questions on the test
- Don’t waste time fighting “ideological battles” – stay focused on the data, the questions, and the students’ results
- Know the data
- Know the difference between the first assessment and the third or last
- Keep analysis connected to a concrete action plan.
A climate conducive to becoming data-driven has some common themes:
- Multiple forms of data are used to disaggregate across disciplines and grade-levels
- Structures in place to facilitate teaming, collaboration, norming, and taking full responsibility for all roles within the data analysis process
- Technology integration to facilitate data retrieval
- Data literacy that allows all teachers to understand how to interpret and analyze multiple forms of data
- Commitment from all educational stakeholders to use, analyze, and take action on data.
- Accountability for results and next-steps
- Team collaboration
An effective data culture facilitates meetings that are characterized by full knowledge of assessments in advance of their administration (transparency), indicators of speculation about the assessments (teacher-ownership), professional development opportunities for data analysis, answers to the fundamental question” Why the students did not learn it?, models of effective data analysis and a solid action plan for follow-up.
Tips for Effective Data Sessions

Use guiding questions:
- Do we have the data that answer the questions we have about how our students are performing academically?
- Are there structures in place that allow for a leveraging of data with curriculum and strategies for effective instruction?
- Do all members of the data team have the skills necessary to analyze data, make decisions, and take action?
- Are all decisions and next steps based on the data at hand?
- Are all stakeholders involved and engaged in the data decision-making process?
Other Questions to Consider:
- Is staff collaboration facilitated and scheduled for, thereby highly valued?
- Are all stakeholders on board for continuous use of data toward student academic improvement at the school and classroom levels?
- Is data-driven decision-making modeled for staff that need it?
- Is data analysis modeled for those who need it?
- Are all on board in using data to inform instruction?
- Are all teachers open to changing instructional practies based on what the data say about student learning?
Bambrick-Santoyo, (2010). Driven by Data: A Practical Guide to Improve Instruction. San Francisco, CA: Jossey-Bass
J, M. H., Gentry, R., & Dalley, T. (2003). Mindful change in a data-driven school. Principal Leadership, 3(6), 37-41.