Differentiating With Data
| Site: | Literacy Solutions On-Demand Courses |
| Course: | Methods of Instruction for ELLs, Grades K-12 - No. ELL-ED-112 |
| Book: | Differentiating With Data |
| Printed by: | Guest user |
| Date: | Wednesday, July 15, 2026, 3:01 AM |
Description
no insert
1. Learner Profile Data
Learner Profiles
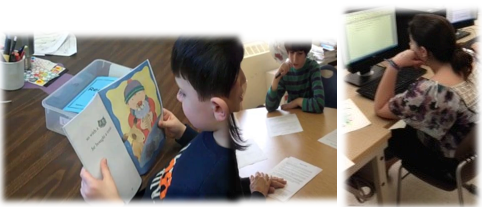
Differentiating instruction also involves purposefully gathering and organizing data to create individual student learning profiles with. We administer these profiles in order to get to know our learners better, which then allows us to plan instruction and hence: differentiate. Learning profiles help us understand our students’ multiple intelligence strengths, their learning styles, what prior knowledge they have about a subject, what they’re interested in, how ready they are to learn something, what they are most challenged by, and what their learning limitations are if any.
How do we get this data? A number of ways:
- Standardized test scores
- Reading inventories
- Concepts inventories
- Learning style Inventories
- Writing samples
- Multiple intelligences checklist
- All About Me surveys
- Parent/home surveys and language surveys
- IEPs
Grouping students is part of differentiating, but not always necessary. When it is, group students using formative assessment data. Here are some considerations for grouping:
Who the leaders are Who the problem solvers are Gender Energy Levels
Backgrounds and interests Strengths
Creativity Artistic interests
When students become personally and intellectually engaged, they are more motivated to learn because their emotions become involved. They are mind-active rather than mind-passive (Erickson 2001)
- Emphasize meaningful, relevant, and worthwhile content to motivate and challenge
- Engage importance by teaching specific areas in depth rather than broad, general concepts
- Adjust curriculum to match and accommodate students’ readiness levels or -
Vary the Process:
- Include diverse reflection activities to build long-term retention
- Use journal entries, drawings, organizers, questions, exit cards
- Orchestrate frequent opportunities for choice
- Use available technology resources to gather and integrate information
Of utmost importance to differentiated curriculum, is that we vary the content, the process, the product, and the assessment (Tomlinson, 2003; 2008; 2010; Wolfe, 2001). Below are some examples of what this would look like in planning:
|
Content |
Process |
Product |
Assessment |
|
Language Arts
|
Students discuss poetic conventions and analyze classic poetry for meaning. Students write their own poetry, act it out and read it aloud to peers for feedback. |
Student biographical poems Acrostic poetry using names and personal attributes Performance poetry |
Poetry rubric Self-assessment rubric Peer evaluation rubric Portfolios |
|
Mathematics |
Students explore 3-dimensional materials, describe shapes, sorting and classifying, identifying and labeling, interactive writing |
· Definitions, descriptions and process posted throughout the room · Shape stories created with new vocabulary and illustrations that depict concepts |
Standardized tests Tiered questioning Shape stories |
There are also cognitive concepts that work into why and how we differentiate, of which we will expand upon later in this course.
2. Becoming Data-Driven
What does it mean to be “data-driven?"
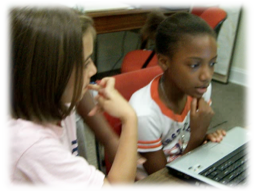
First, data should always answer one simple question: Are our students learning? There are four key principles that describe a data-driven environment where teachers use and analyze assessment, plan for and pursue action research, and work diligently to maintain a data-driven environment in their classrooms, or establishing a "data culture". Bambrick (2010), in Driven by Data, describes the attributes of these four principles:
- Assessment must be rigorous, and interim assessment must provide meaningful data.
- Analysis should involve the reexamination of results to identify root causes of students' strengths and learning gaps.
- Data action invokes teaching strategy focused on precisely on what students need most to learn.
- A data culture is an environment in which “data-driven instruction can survive and thrive” (p. xxvi).
We are warned however, about some mistakes that are commonly made when using data to drive instruction. As we acclimate to the use of data, there are inevitably small learning curves, such as knowing how to schedule time for teams to look at data, scheduling time regularly to do so, making resources accessible with which to pursue action research and dig deeper into the information we glean about our students that will evolve from the data. Among the mistakes we will make, at first, are also:
- Using only standardized assessments at the expense of valuable benchmark and interim assessments.
- Misaligning assessment to curriculum. Teachers and their teams will likely need some practice in, and experience with, curriculum alignment to standards for example, prior to aligning assessments to curriculum.
- Delayed assessment results that cause for delayed action, such as reports in October for assessments that are taken in April or May.
- Ineffective follow-up to assessment data. What do we do with the data? These are common questions among teachers. Telling them to inform instruction, plan, and teach differently are not specific enough. Follow-up to assessment data involves specific action steps with measurable student outcomes (Bambrick, 2010).
A successful data culture is driven by the following: assessment, analysis, action, and culture. Let's begin with interim assessments, because they are at the heart of the data we need to be truly effective. By deeply analyzing interim assessment results, teachers can make corrections to curriculum and instruction to assure students learn at the highest level possible.
The Role of Interim Assessments
Interim assessments play an essential role in a data-driven environment, and often move an effective data-driven culture forward. Interim assessments are sometimes referred to as "benchmark" or "midline" assessments. They can also be formative or summative, and typically would fall in between the two in terms of when they are administered. For example, if a teacher wants to know where students are in a learning process, like partway through a unit or longer lesson, an evaluation would be given to determine if they are headed toward mastery of a concept or skill, and if any intervention is warranted. Interim assessments might also mirror a type of summative assessment to help students prepare to respond similarly. They are usually administered every six to eight weeks throughout the school year.
Interim assessments must be carefully and strategically thought out, especially if they are in the form of written tests, otherwise using them to effectively analyze strengths and weaknesses is impossible. Here are some important considerations when creating interim assessments:
- Set the bar high
- Align them to student, grade-level goals and objectives
- Align them in rigor to the state assessments (create them side-by-side to one another).
- Include written and open-ended responses; never leave these responses out for sake of easier to grade multiple-choice.
- Reveal and review the interim assessments ahead of time – they’re maps that let you know where to go with your instruction.
Assessment is at the heart of what we need to know about our students, and evaluating their progress along a continuum of growth is the best way for us to determine what they know and are able to do. Assessment must be common and frequent to accurately track, evaluate, and predict, student progress (Bambrick, 2010). To be especially effective, assessment should take place monthly, without occupying the majority of curriculum time. Our best and most effective assessment, in terms of giving us actionable feedback about our students, should also be formative, thereby allowing us to draw information about them while they are still working, and while we are still teaching them (Bambrick, 2010).
Curriculum Scope and Sequence
It is vital that assessment be aligned to what will measure students for ultimately – strengths and weaknesses; goals and objectives; curriculum scope and sequence. The scope and sequence needs to match the interim assessments in order to know what to teach, what to assess, and what to do with the results. These results need to be immediate so that we can be proactive, with results analyzed through data teams or PLCs. Teachers should analyze their own students’ results, making their own plans for, and with, those results (Bambrick, 2010).
Data Culture Framework
- Use of common interim assessments
- Regular grade level team meetings where teachers and administrators analyze results, establish common goals, and develop lessons, units, or curriculum.
- Development of action plans, action research, or data next-steps to aid in the strategic decision-making needed to strengthen core instructional approaches.
- Develop assessments around the standards.
- Understand and be clear about how students will be evaluated; know what the end is and begin with them (Bambrick, 2010).
- Use in-the-moment assessments that require constant checks for student understanding with opportunities to make adjustments to instruction. Often these checks for understanding are more powerful than interim assessments with the immediate data received about the extent to which students are learning, and why they are not.
Here are four cardinal rules about assessment:
Assessments must be…:
- the starting point
- transparent
- common
- interim
The Starting Point:
“for data-driven instruction to be effective, this process must…be created before teaching ever begins. In data-driven instruction, the rigor of the actual assessment items drive the rigor of the material taught in class” (p. 12).
- Assessments must be written before teaching begins so that adjustment can be made to curriculum and lessons in order to address all skills necessary.
 Common and Transparent Assessments
Transparency means available to all educational stakeholders – teachers and school leadership alike. In addition to using standards to drive rigor, assessment data must drive it too. The public visibility of this data assures that all educational stakeholders know what the markers are, where students have gone, where they need to go, and what needs to be done to get them there. Common assessments assure that all content areas have the same expectations. Common assessments have repeatedly proven to further the sharing of ideas among teachers, collaboration and facilitate effective curriculum design (Bambrick, 2010; Reeves, 2008).
This course will delve carefully and enthusiastically into the development and use of data to employ effective on-going instructional decisions that work into high student achievement by looking at what it means to be data-driven, what a data-driven culture looks like, how to use formative and interim assessment data effectively. Such data might include data we might not have considered to be "data" in the past, such as student artifacts, lesson plans, curriculum tools, and performance tasks. We'll look at protocols to use in teacher teams, what studies have shown and what research says about their use within a data culture. Most important, we will learn what tools and resources can, and have been, used to effectively analyze and use data responsibly. Decision-making that results from the collection, analysis, and interpretation of data will work into responsible planning with strategy for effective instruction. This course will examine and practice with all of this throughout the 10 modules of this course. In addition to best practices for analyzing data in teacher teams, we’ll look at methods that involve students in their own decisions about data as tools that self-inform and build school-wide collective capacity.
References
Bambrick-Santoyo, P. (2010). Driven By Data: A Practical Guide to Improve Instruction. San Francisco, CA: Jossey-Bass.
Reeves, D. (2003). High Performance in High Poverty Schools: 90/90/90 and Beyond. Center forPerformance Assessment.

3. Student Artifacts as Data
Charlotte Danielson (2013) identifies student artifacts, or data for non-observable components of teacher evidence (Danielson Instructional Framework, 2013) with which to establish a culture of learning with high value for what is being learned, high-quality expectations, and in recognition of student effort. These are those non-observable components to daily instruction that we typically might not regard as valuable data. In fact, this data has proven to be quite valuable within the entire spectrum of student learning, from planning and implementation, to final product. Communication with all stakeholders - students, parents, leadership, and teachers - helps to establish clarity of lesson, purpose, instill enthusiasm for learning, and provide reinforcement for those high cognitive challenges needed to formulate inquiry and develop high levels of student participation. Those non-observable artifacts to teaching can provide some of the meatiest and most meaningful formative assessment data when we seek immediate change in student progress.
Non-observable artifacts:
|
Lesson plans IEPs Portfolios Newsletters Videos of teaching practice Assignment design Use of data Learning objectives Learning targets Rubric development Emails |
Phone logs PLC notes Data analysis Discipline referrals Posted routines Posted rules and goals Teacher work products Student reflection journals Programs Guest speakers Work with special education teachers to modify curriculum |
Exit tasks Teacher website Clock hour transcript(s) Student goal setting form Curriculum development Leading professional development activities Peer assistance Mentoring coaching Student work samples Common assessments Formative assessments/Summative assessments |
|
|
Other examples from within the classroom and overall instructional environment include:
- Created bulletin boards
- Displayed student work
- Displayed class rules, inspirational posters
- Class contract establishing expectations

- Artifacts depicting classroom management procedures
- Artifacts depicting organizational procedures
- Artifacts depicting management of student behavioral procedures
- Samples of student work (projects, homework, labs, independent readings, essays, etc.)
- Assessment tools (quizzes, exams, reading activities)
- Field trip/guest speaker records
- Records of contests entered and/or won by students
- Interdisciplinary instruction
- Samples of homework assignments
- Samples of differentiated instruction
- Artifacts of motivational activities
- Examples of independent study activities
- Examples of group work activities
Observational data, also known as kid watching, helps us understand what students know and what they do not know. Below are some techniques useful in capturing and documenting data about what students know and where they need continued instruction or assistance (found in the Course Objectives | Research | Materials folder):
Anecdotal Notes: Short notes written taken while a lesson is in progress as students are working in groups or individually.
Anecdotal Notebook: A record using a notebook of ndividual student progress as they work, looking at student performance over time.
Anecdotal Note Cards: Notecards are used to record observations on students with.
Labels or Sticky Notes: Teachers carry a clipboard with a sheet of labels or a pad of sticky notes to make observations with while circulating the classroom. Notes are placed in student folders later.
How do these artifacts work as formative assessment data? How do we glean them for the kind of information we need in order to improve, and/or result in, focused instructional delivery? Let's continue to keep this in mind as we explore more about data-driven strategy - how to analyze data, what to do with the analysis, how to leverage existing practice with new strategy geared specifically to what the data say students need.
Danielson, C. (2013). The Framework for Teaching Evaluation Instrument. Princeton, NJ: The Danielson Group.